Probability, the likelihood of an event occurring, must be between 0 and 1 and must sum to 1 across all possible events.
$(x_n)$ represents a possible event.
$P(x_n)$ represents the likelihood of the possible event occurring.
$0\le P(x_n)\le1$ represents the likelihood of an event occurring, must be between 0 and 1.
$\underset{n=1}{\overset{N}{\sum}} P(x_n)=1$ represents the sum of all possible events, must equal 1.
A probability distribution is a function or plot of the probabilities. The distribution can be discrete, continuous, or a mixture of both.
Discrete probability distributions use only integers or whole numbers. Thus, discrete distributions have a finite range.
Continuous probability distributions can use any value within a given range. Thus, continuous distributions have an infinite number of possibilities.
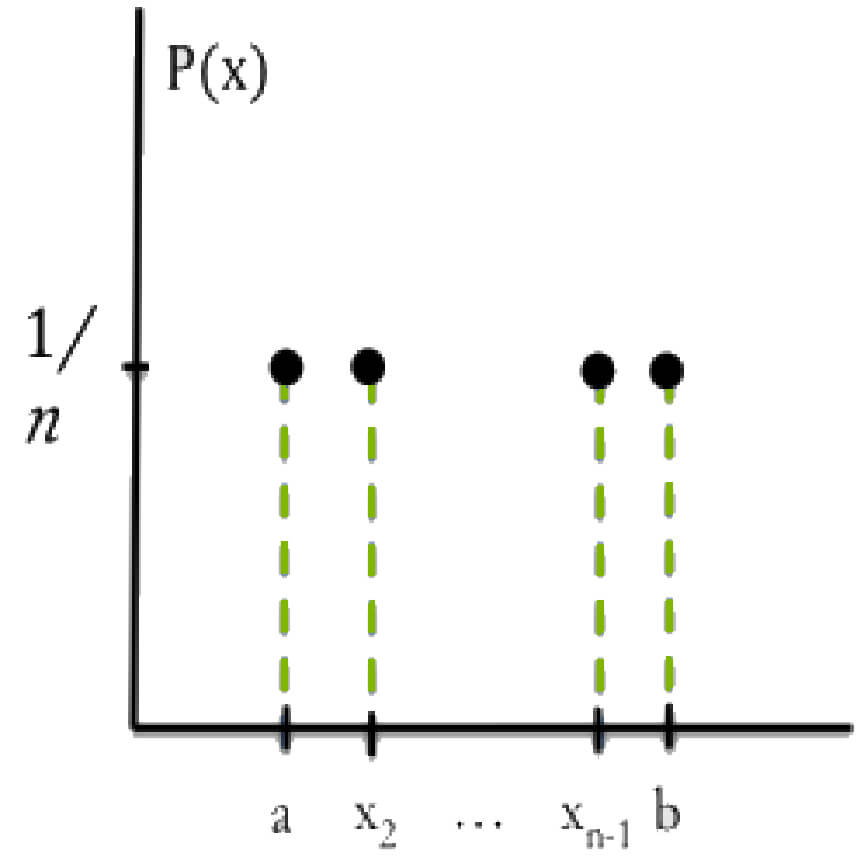
This is a distribution where the probabilities for each discrete value are the same. In other words, each value is equally likely to be observed. $$Px_i=\frac1n,\{x_1=a,...,x_n=b\}$$

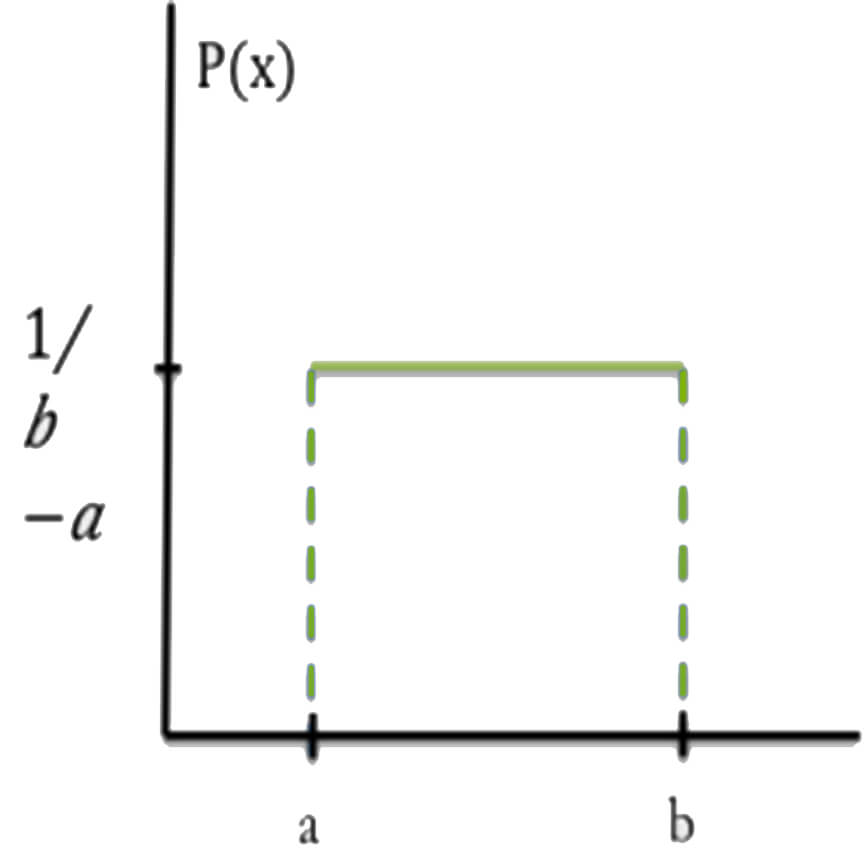
This is a distribution where the probabilities for each of the infinite possibilities of values are the same. Again, each value is equally likely to be observed. $$P(x)=\frac1{b-a}\;for\; a\le x \le b\;at\; 0$$

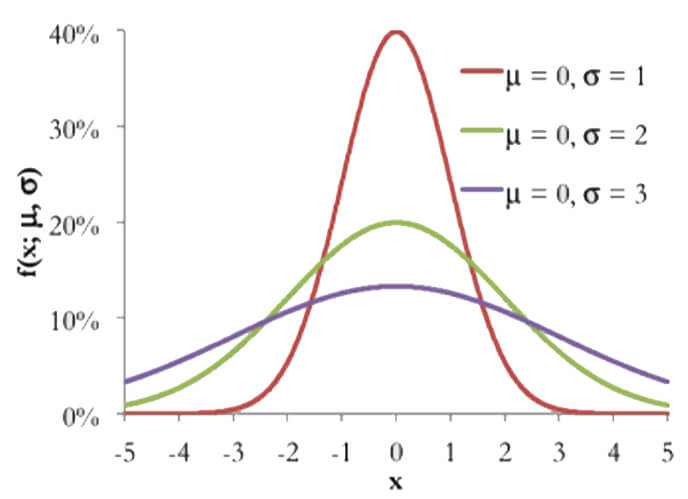
A normal distribution is a symmetrical distribution of values within a data set. The mean of the distribution should also be the mode and median of the data set. Since the distribution is symmetrical, it is not skewed. $$f(x,\mu,\tau)=\frac1{x\tau\sqrt{2\pi}}e^\frac{-(x-\tau)^2}{2\tau^2}$$

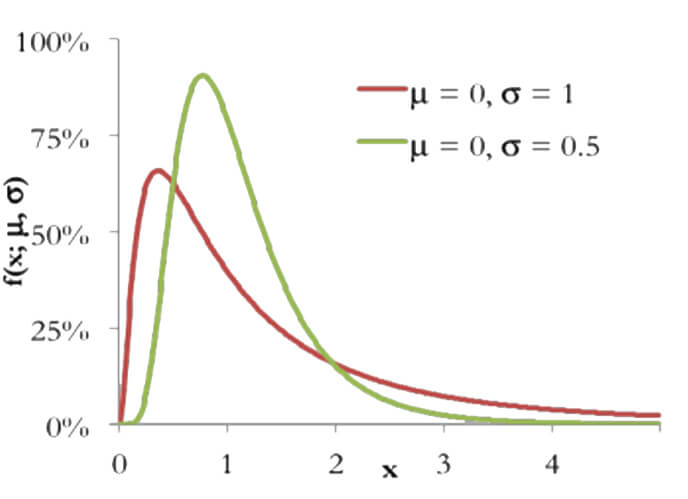
A lognormal distribution is when the natural logarithm ($ln$) is normally distributed. They are asymmetrical and create a right-skewed curve. They only have positive values since a logarithm cannot be negative. $$f(x,\mu,\tau)=\frac1{x\tau\sqrt{2\pi}}e\;(-\frac{[ln-\mu]^2}{2\tau^2}),\;\;x\in(0,\infty)$$

This is a discrete distribution with probability distribution: $$\frac{(e^{\lambda}\lambda^{x})}{x!}$$
This is a continuous distribution with probability distribution: $$(\frac{1}{\theta})e^{\frac{-x}{\theta}}$$
This is a continuous distribution with probability distribution: $$\frac{(x^{a-1}e^{\frac{-x}{\theta}})}{\Gamma(\alpha)\theta^{\alpha}}$$
This is a continuous distribution with probability distribution: $$(\frac{\Gamma(a+b)}{\Gamma(a)\Gamma(b)})x^{a-1}(1-x)^{b-1}$$